Device Monitoring
This section provides background information on powermanager devices. For instructions on monitoring powermanager devices, see the step-by-step section.
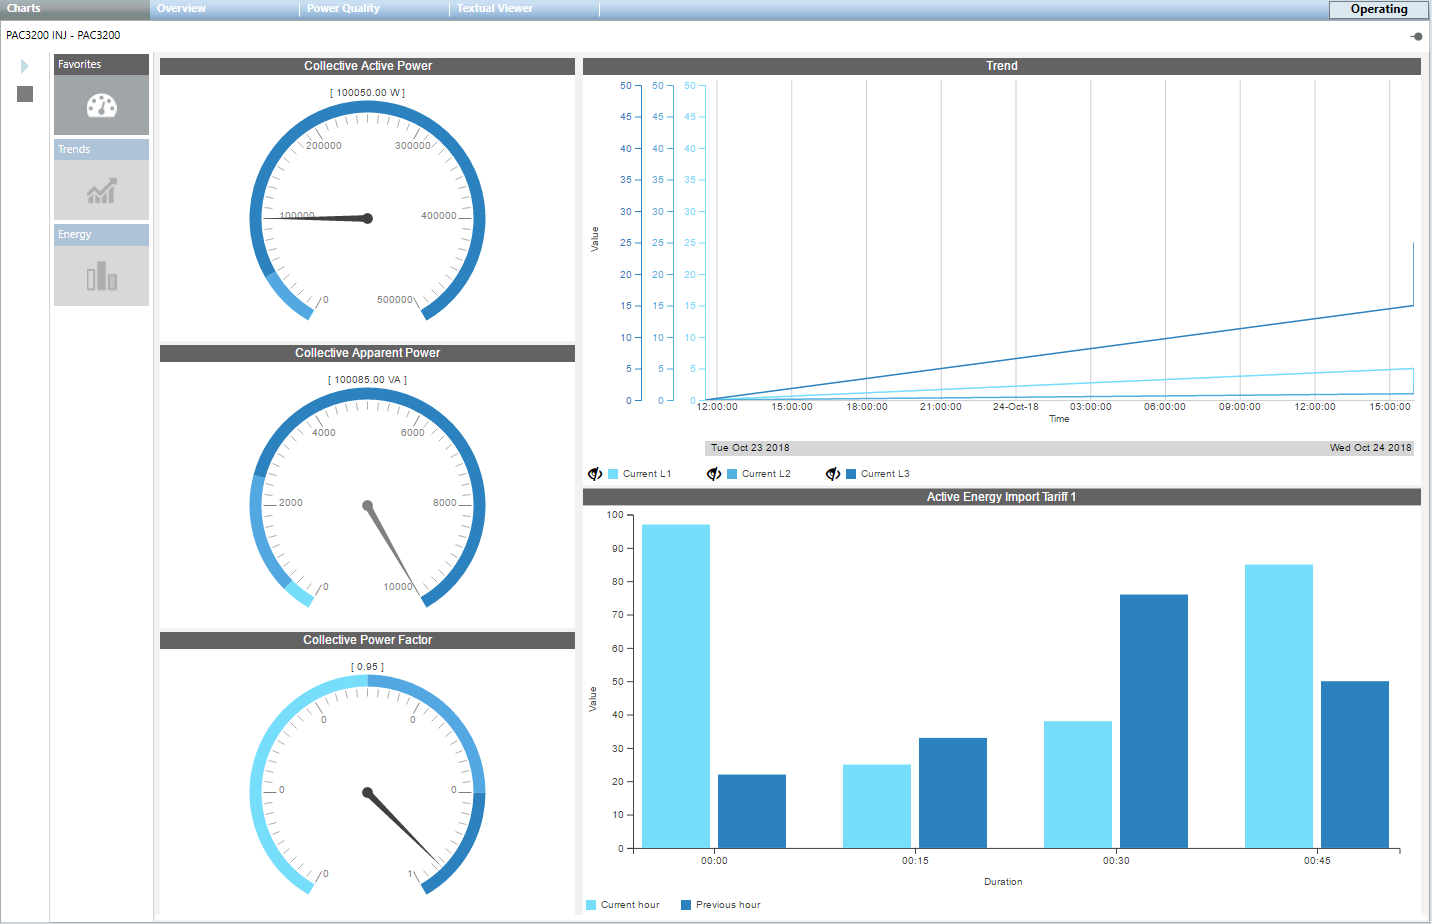
The Charts tab contains the following tiles:
- Favorites: (default selection): Displays the control such as gauges and trends associated with their configured measurement points. There are three gauges that display the values of the configured measurement points.
- The gauges display measurement point descriptions, color range and values along with the units.
- The Trend control represents the variations in the values of a device over a specific time range. A trend can contain any number of hierarchically arranged areas for representing curves, with scales and legends. Trend view allows for a visual comparison of individual trends.
- The bar chart section displays the configured measurement point with a month as the default interval.
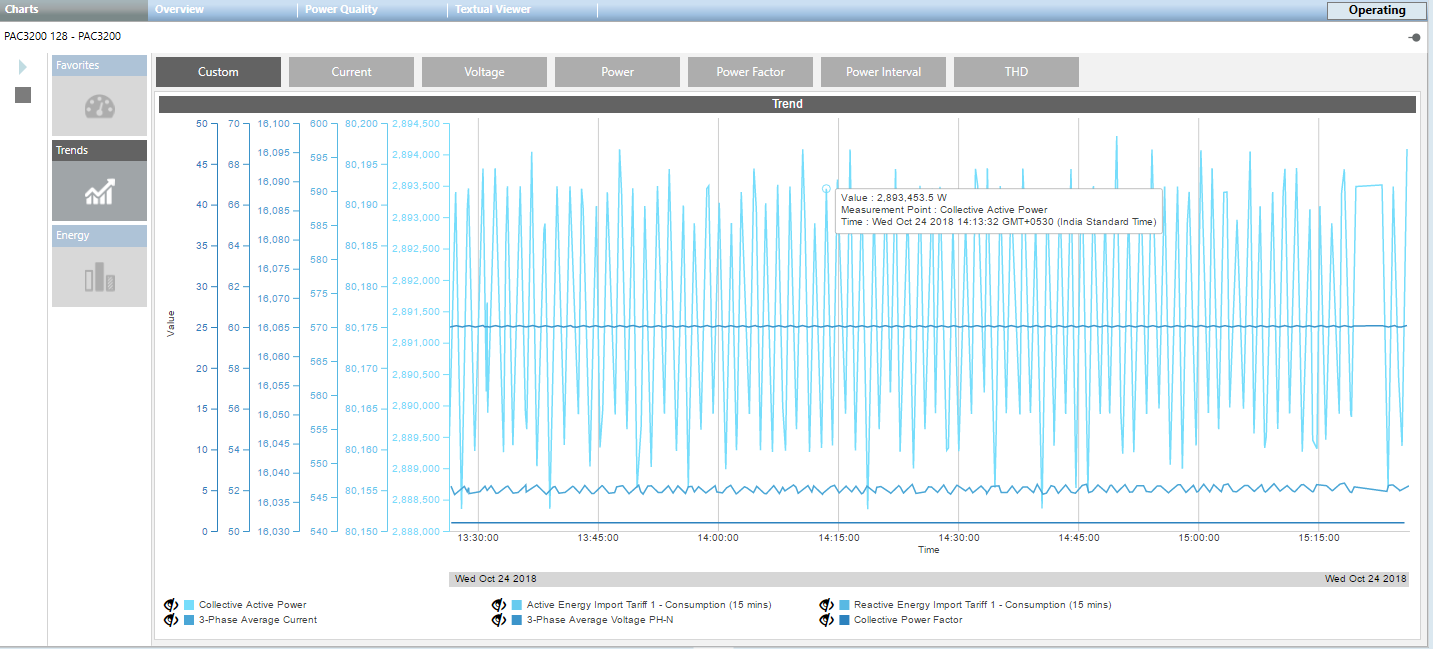
- Trends: When you click the Trends tile, it displays the live trend series for the measurement points that are configured.
It has options to start and stop the live trend when you click Start .
.
It also has options to show or hide the data points associated with the trend when you click the toggle icon.
Additionally, you can zoom the data in the trend chart by hovering over the trend and scrolling.
You can also change time duration the trend using the range selector option at the bottom of the trend.
You can view the trend information for any of the following parameters: - Custom: You can view the live trends of the measurement points that are already configured.
- Voltage: You can view two sets of trends under this tab. The trends in 3-phase-to-phase-voltages and the average-phase-to-phase voltage is the first set. The second set of trends is 3-phase-to-neutral voltages and average-phase-to-neutral voltage.
- Current: Displays the trends in 3-phase currents and average current.
- Power: Displays the total active power and reactive power trends.
- Power Internal: Displays the trends of cumulated active power import and the cumulated reactive power import.
- Power Factor: Displays the trend of the total power factor.
- THD: Displays trends of current and voltage.
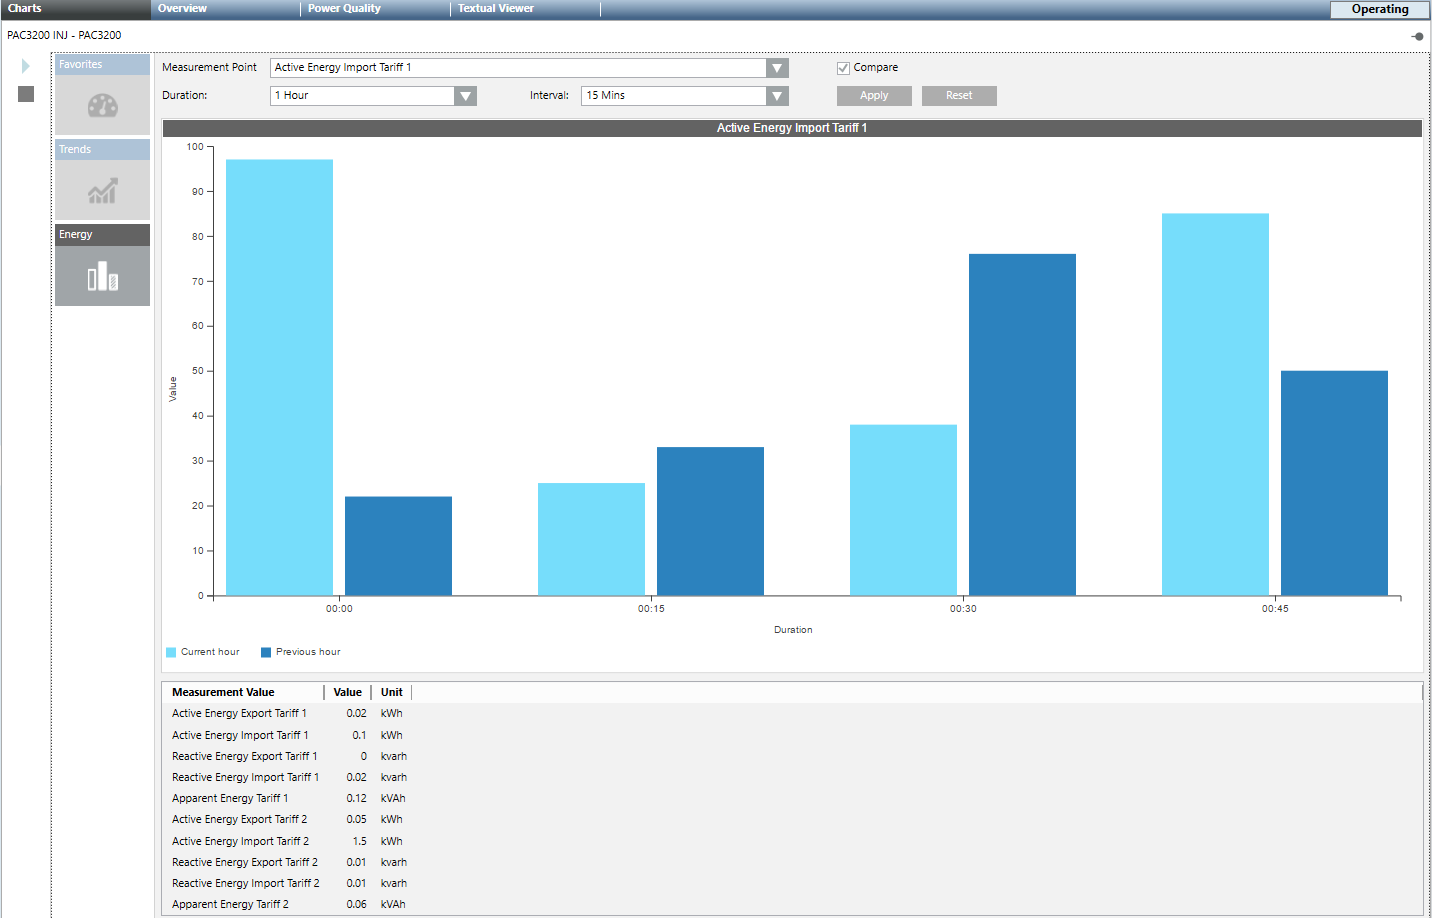
- Energy: When you click the Energy tile, it displays the energy consumption details. It also enables you to compare the energy consumption between 2 different time ranges. It consists of the following fields:
- Measurement Point: Displays the already configured measurement points. Active Energy import tariff 1, 1 hour and 15 minutes are the default values. Also, the Compare check box is deselected by default. You can select any of these points to display the trend series for the point.
- Duration: Displays the bar chart for the selected duration.
- Interval: Displays the bar chart according to the selected interval for the duration selected.
- Compare: Allows you to compare data according to the specified duration.
- Apply: Click to reflect the changes in the trend chart.
- Reset: Resets the selected values.
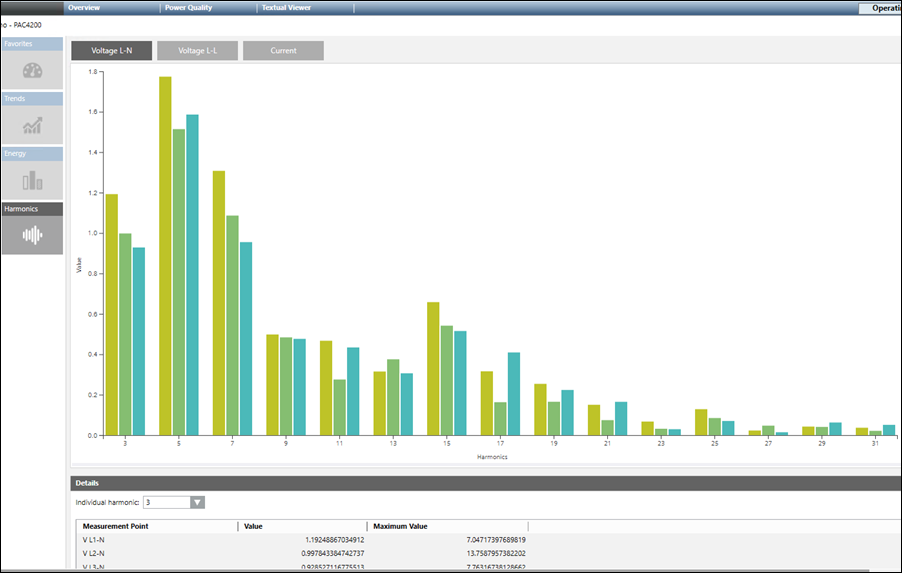
- Harmonics: Allows you to view the harmonic values in a bar chart depending on the following selection:
- Voltage L-N: Displays the line-to-neutral voltage harmonics.
- Voltage L-L: Displays the line-to-line voltage harmonics.
- Current: Displays the current harmonics.
- Individual Harmonics: Select a harmonic to view its detailed values (including time stamp). The bar chart shows the harmonic proportions related to the basic oscillation up to the 17th or 31st harmonic. By default, you see the instantaneous values of the harmonics.
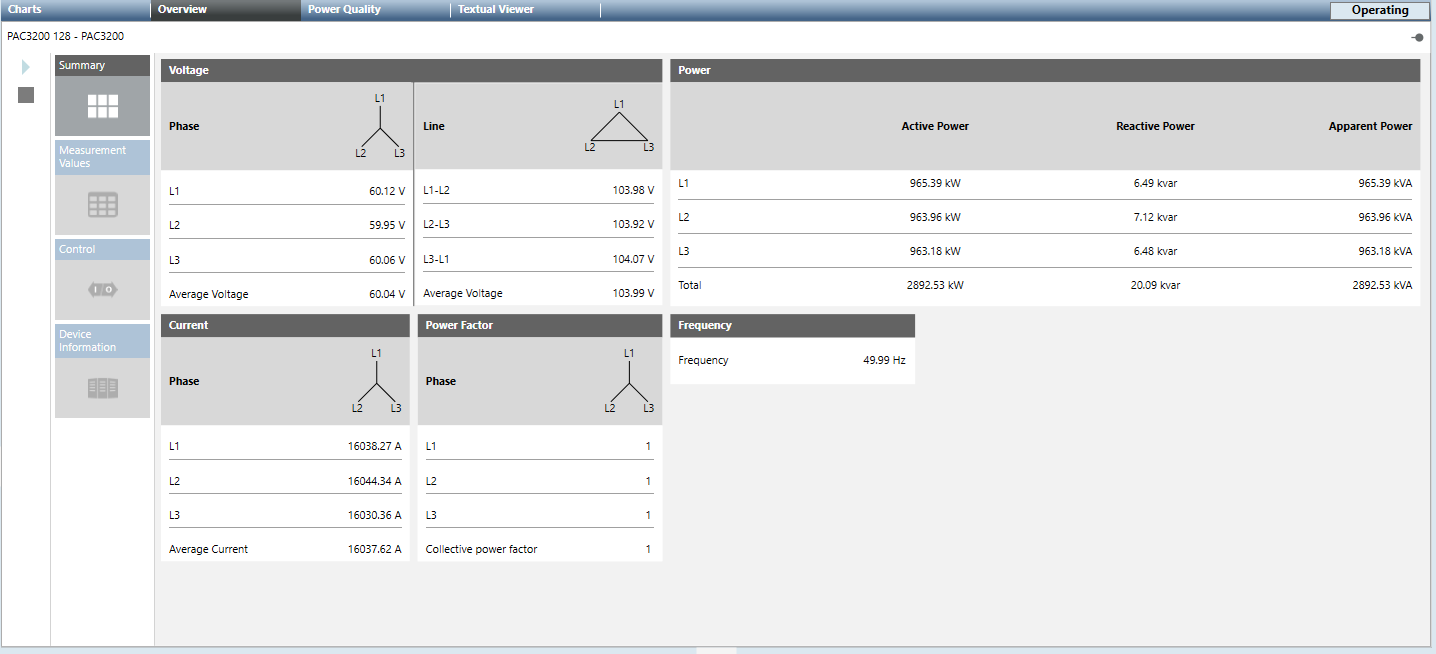
The Overview tab displays the summary of different data point values measured by the devices. It contains the following tiles:
- Summary: Displays the real-time values for Voltage, Power, Current, Power Factor and Frequency.

NOTE:
When an N-Conductor module is connected to a PAC3200 or a PAC4200 device, the N-Conductor details are displayed. The I5, I6 and In values are displayed in this section. Also, the neutral current measured are also displayed in the Summary tile.
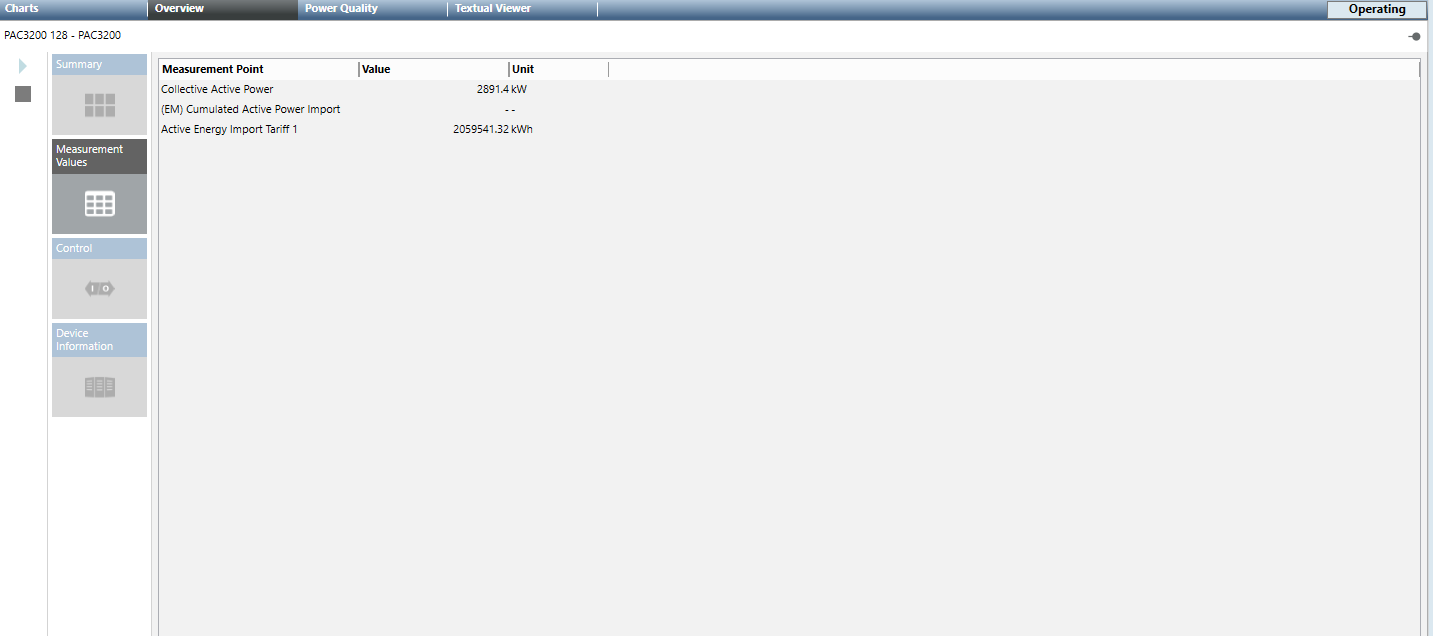
- Measurement Values: When selected, this tile displays all preselected measured variables with description, current measured value, and defined unit. By default, the values for the following items are displayed:
- Collective active power
- Active energy import tariff
- (EM) cumulated active power import
A device not listed under Powermanager Devices, can be configured as the source device for KPI, Average Value device and Calculation Value device. When a non-Powermanager device, used as a source under the above listed logical devices, is deleted, a hyphen symbol is displayed under the Value column.
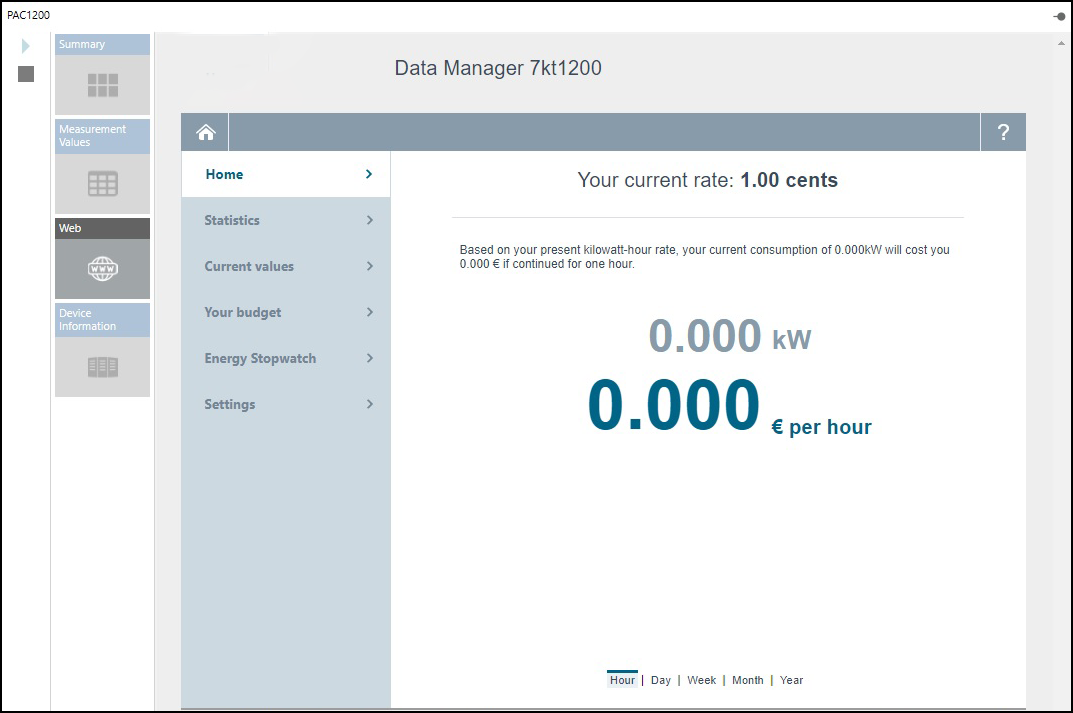
- Web: Allows you to view and edit the device settings online.
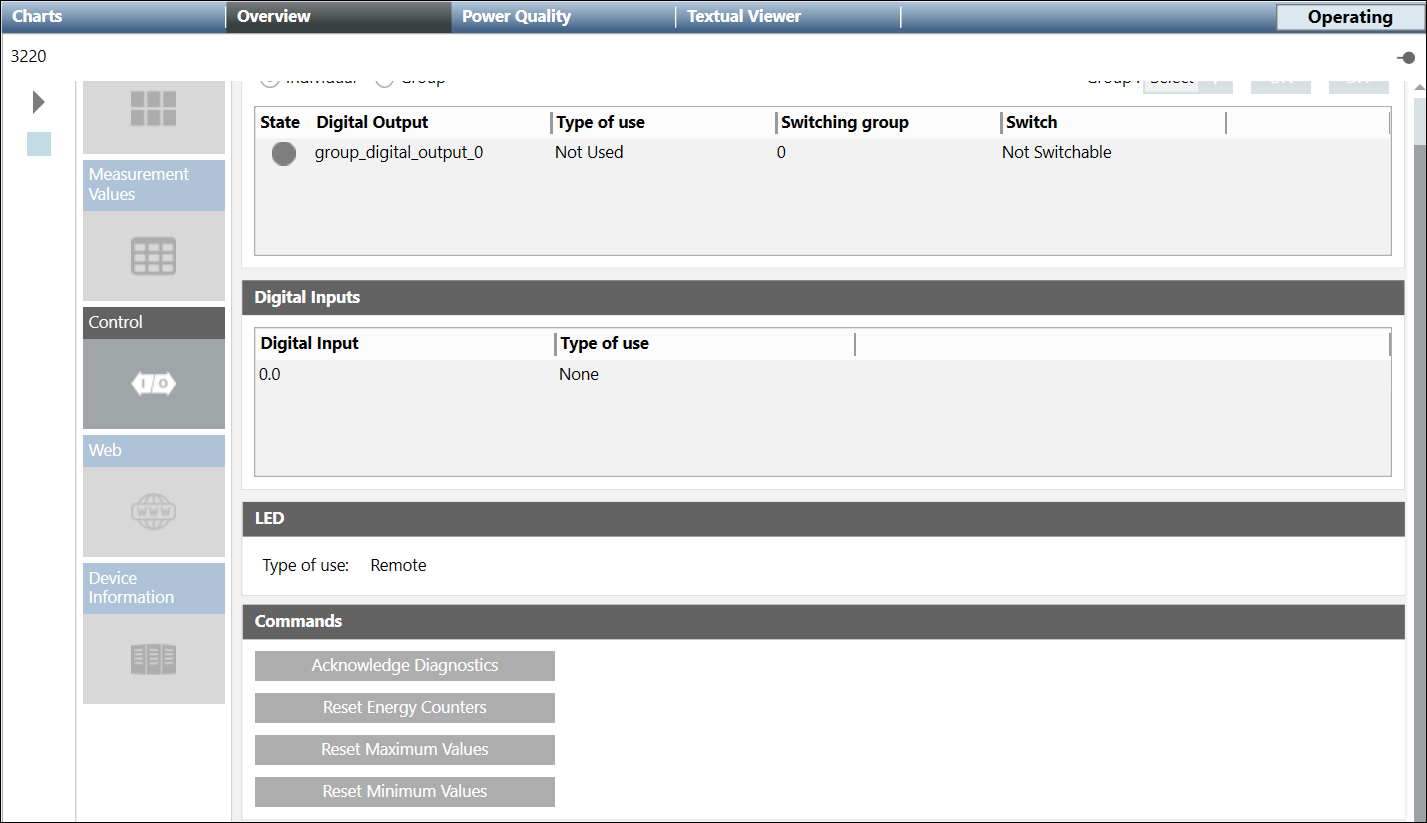
- Control: You can view and operate the status and commands of the respective device in this tile. This tile contains the following:
- Digital Outputs: Allows you to switch the digital outputs of the devices. For this purpose, you must configure the digital outputs as remote output in the device. You can switch on or switch off the digital output by clicking ON or OFF. The switching state is indicated by the following lamp icon:
 - Signal of the digital output is high (1)
  - Signal of the digital output is low (0)
 - Digital Inputs: Displays the digital inputs and its type of use
- Commands: The commands section contains buttons that can be used to change device settings during runtime. The commands can only be transferred if password protection is switched off on the device. Below are the available commands:
- Acknowledge Diagnostics: Acknowledges and resets the diagnosed device performance values.
- Reset Energy Counters: Resets the values for the measurement points to 0.
- Reset Maximum Values: Allows you to update the maximum value.
- Reset Minimum Values: Allows you to update the minimum value.
- LED: Displays the LED usage type for the device.
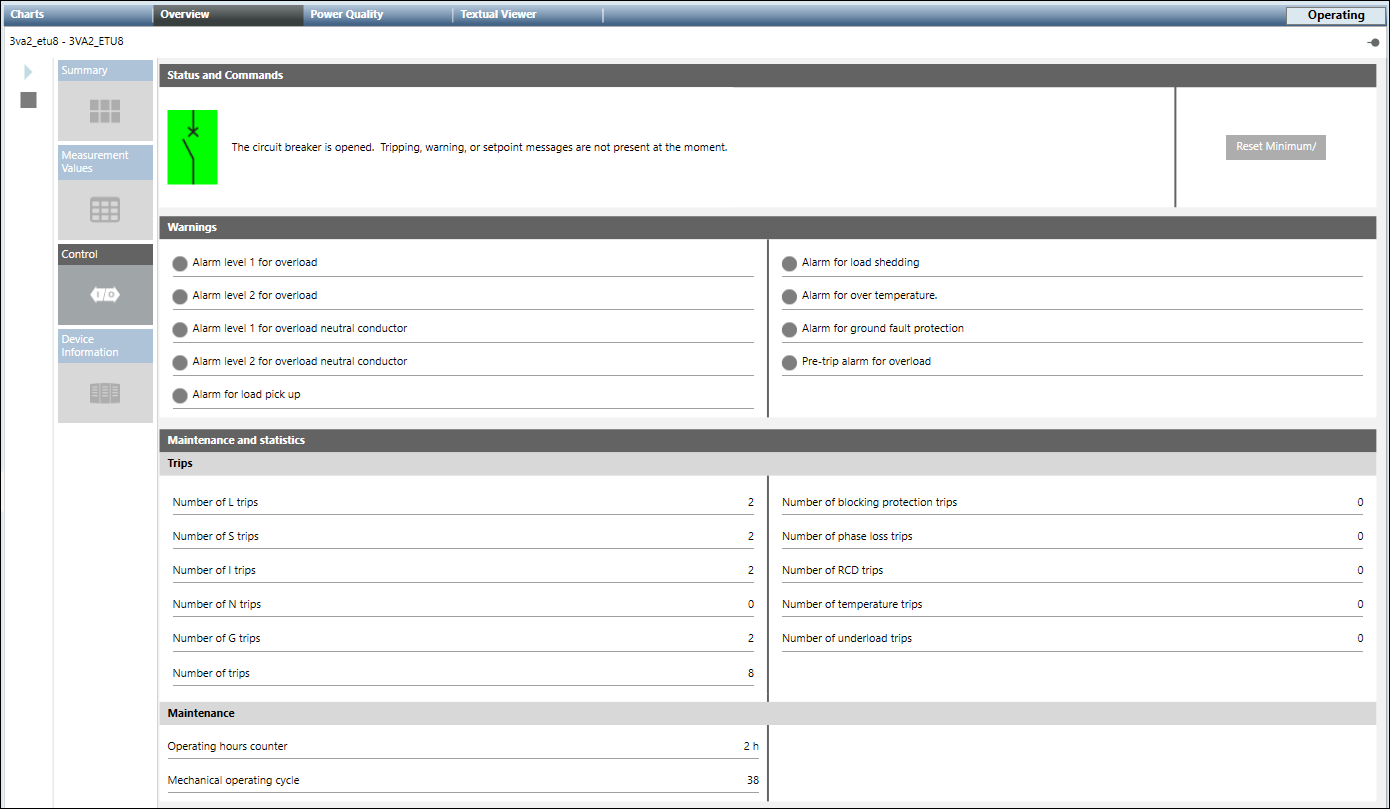
The data displayed in the control tile is different for the breakers. The control tile information of each of the breakers is mentioned below:
Status and Commands: Displays the status of the breaker. Allows you to send commands to the breaker.
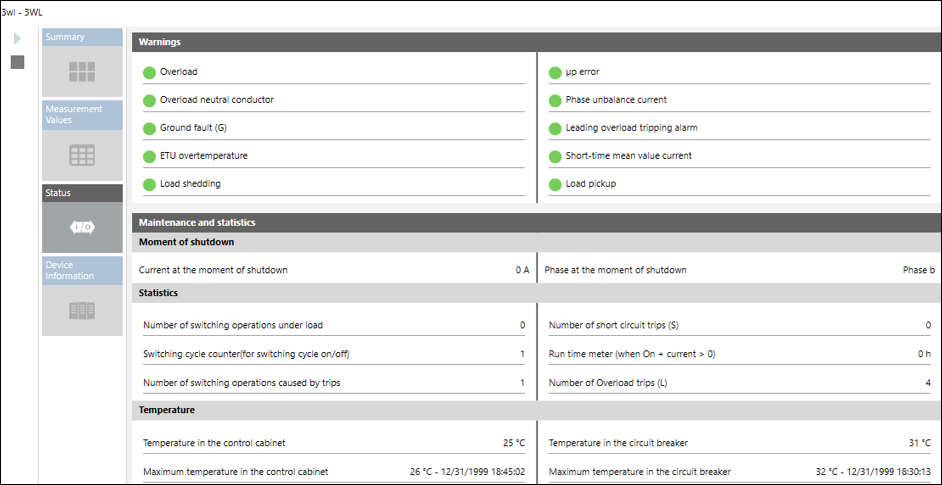
Warnings: Displays the warnings of the device with their respective state.
Maintenance and Statistics: Displays the device statistic and the maintenance data.
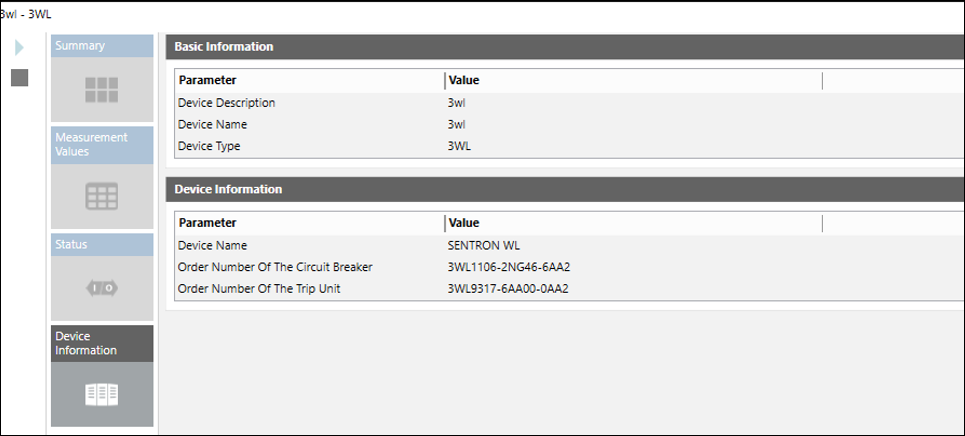
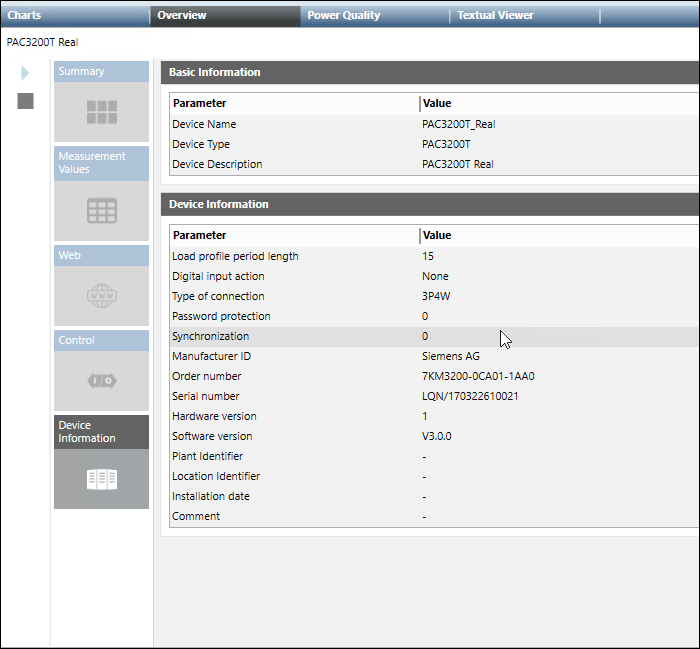
- Device Information: Displays the information of the device including device name, type, description, manufacturer, hardware/software version, and so on.
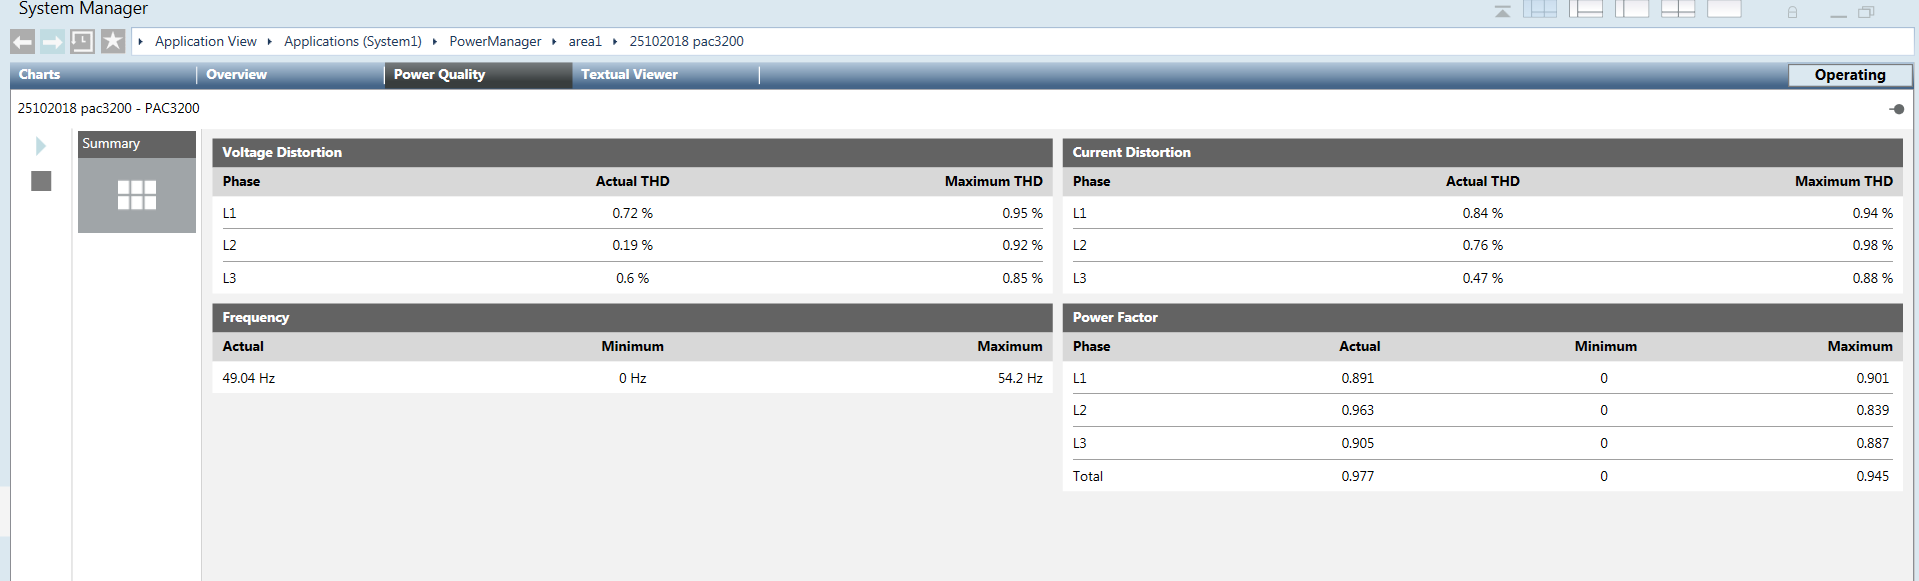
- Summary: Displays the real time values for Power Factor, Frequency, Voltage Distortion, and Current Distortion.
The Overview tab displays the summary of different data point values measured by the devices. It contains the following tiles:
- Summary: Displays breaker information, messages with trip log and event log , real-time values for Active Power, Reactive Power, Apparent Power, Current, and Energy.
You can view and operate the status and commands of the respective device in the Commands section. It contains the following:
Digital Outputs: Allows you to switch the digital outputs of the devices. For this purpose, you must configure the digital outputs as remote output in the device. You can switch on or switch off the digital output by clicking ON or OFF. The switching state is indicated by the following lamp icon: - Signal of the digital output is high (1) - Signal of the digital output is low (0)
Digital Inputs: Displays the digital inputs and its type of use.
Commands: The commands section contains buttons that can be used to change device settings during runtime. The commands can only be transferred if password protection is switched off on the device. Below are the available commands:
Acknowledge Diagnostics: Acknowledges and resets the diagnosed device performance values.
Reset Energy Counters: Resets the values for the measurement points to 0.
Reset Maximum Values: Allows you to update the maximum value.
Reset Minimum Values: Allows you to update the minimum value. 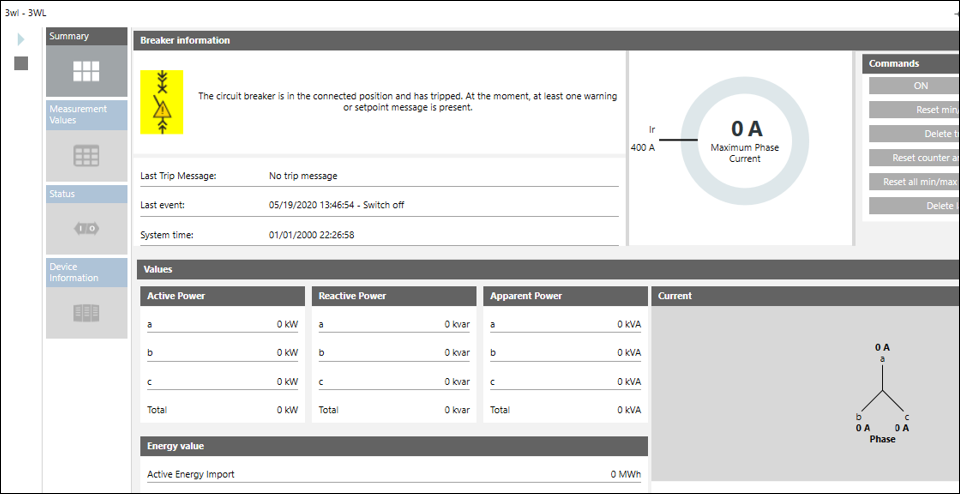
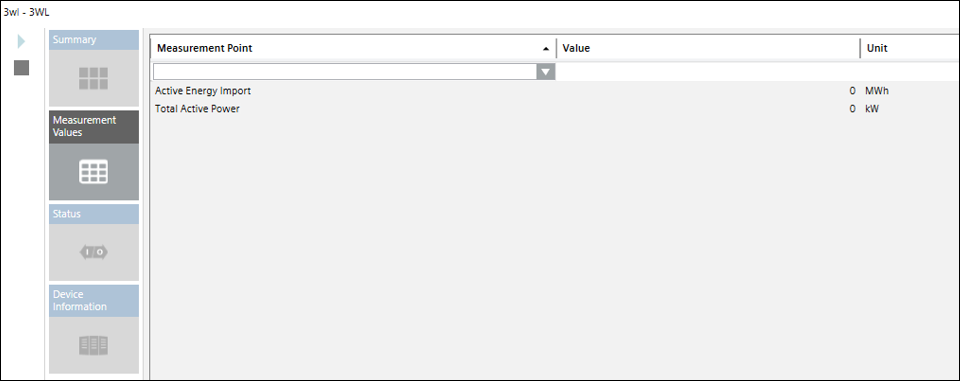
- Measurement Values: When selected, this tile displays the preconfigured measurement points of the selected device with description, current measured value, and defined unit.
A device not listed under Powermanager Devices, can be configured as the source device for KPI, Average Value device and Calculation Value device. When a non-Powermanager device, used as a source under the above listed logical devices, is deleted, a hyphen symbol is displayed under the Value column.
- Status: Allows you to view warnings, maintenance and statistical details of the selected breaker.
- Device Information: Displays the information of the device including device name, type, description, manufacturer, hardware/software version, and so on.